MIND THE MARKETS Education for Financial Independence
Share Price Index 200 Contract (SPI 200) Australian Share Price Index 200 contract as traded on the Sydney Futures Exchange Day Contract trendline and other analysis by David Worrall
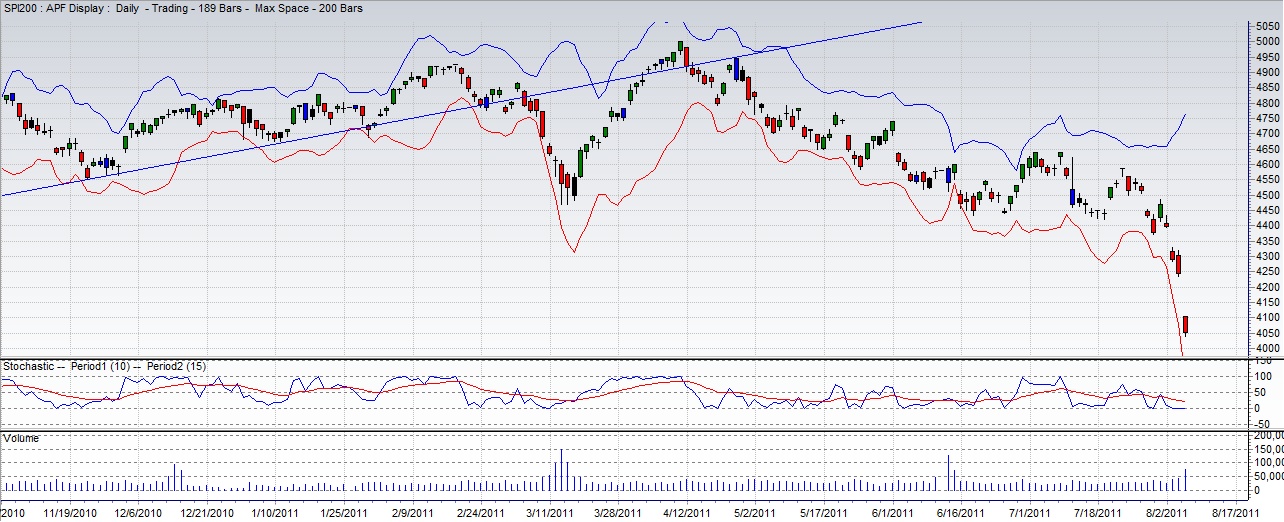
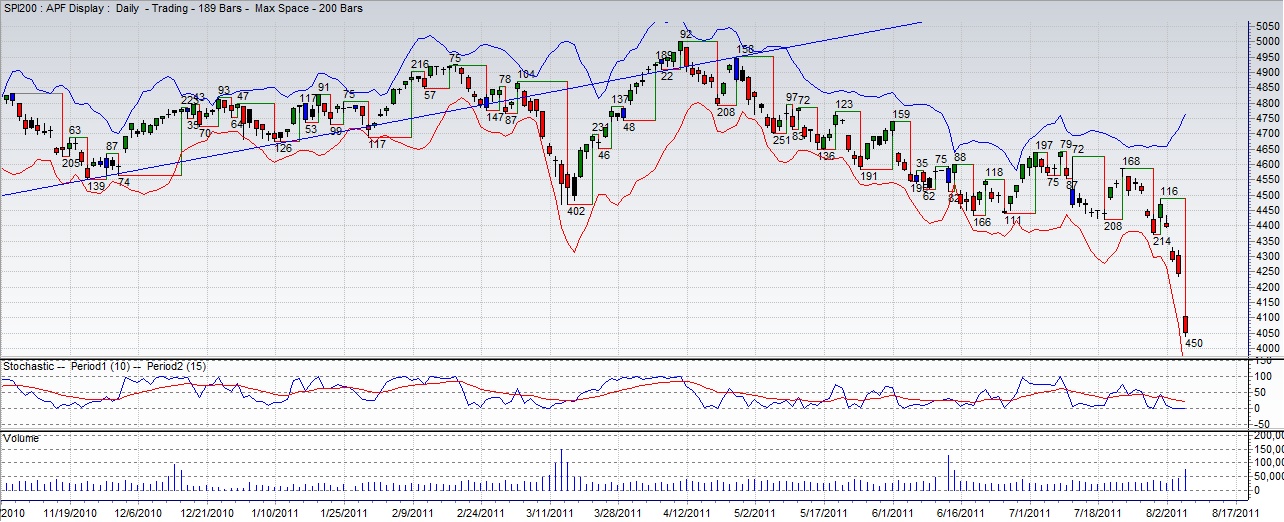
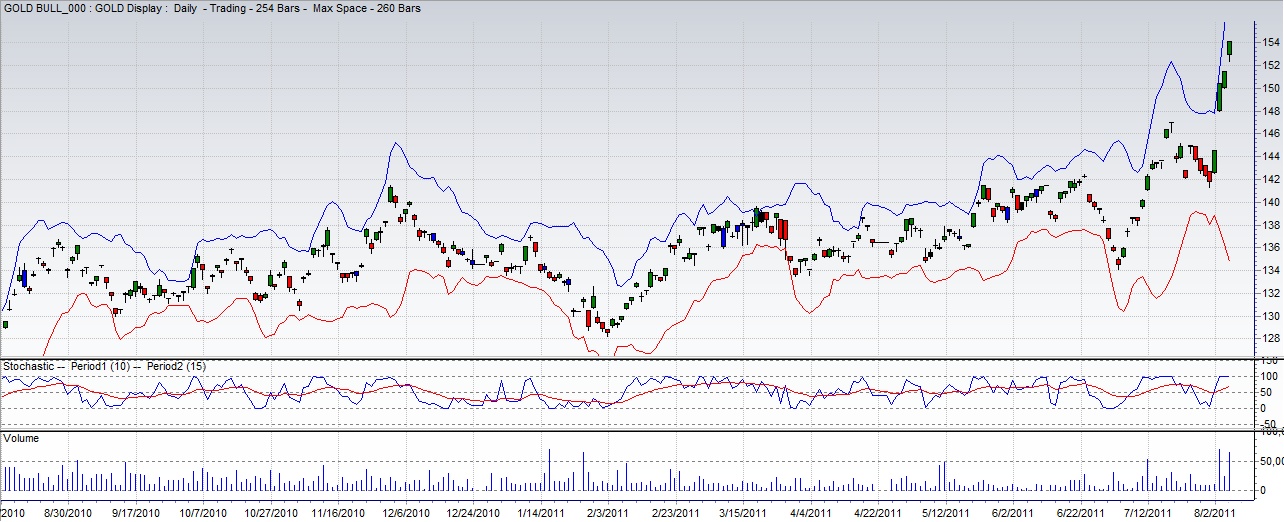
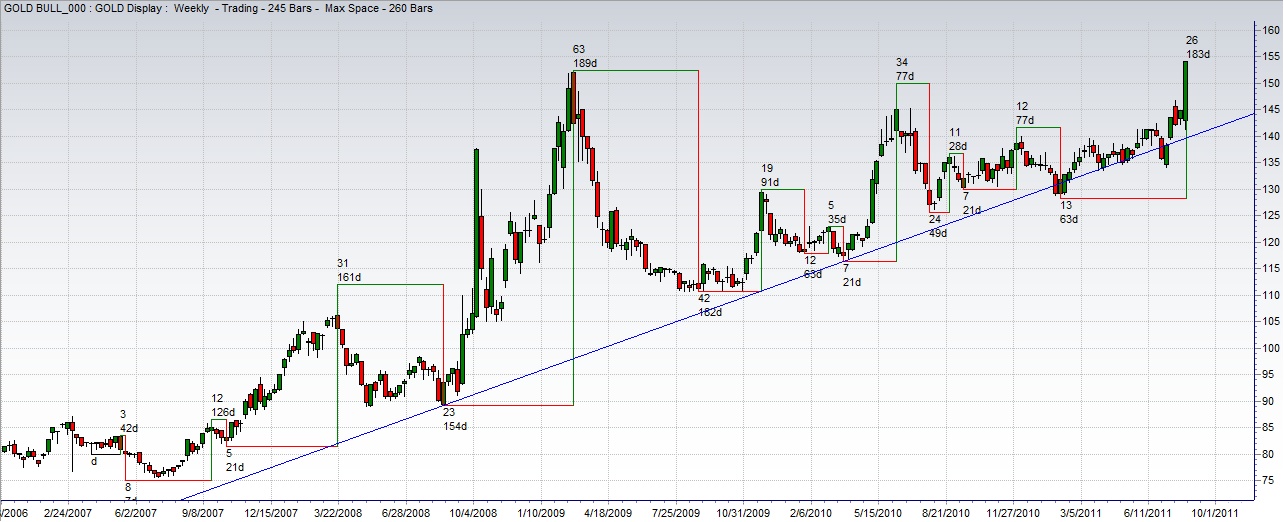
SPI 200 daily Bar Charts. Near view (above) and longer-term (below)
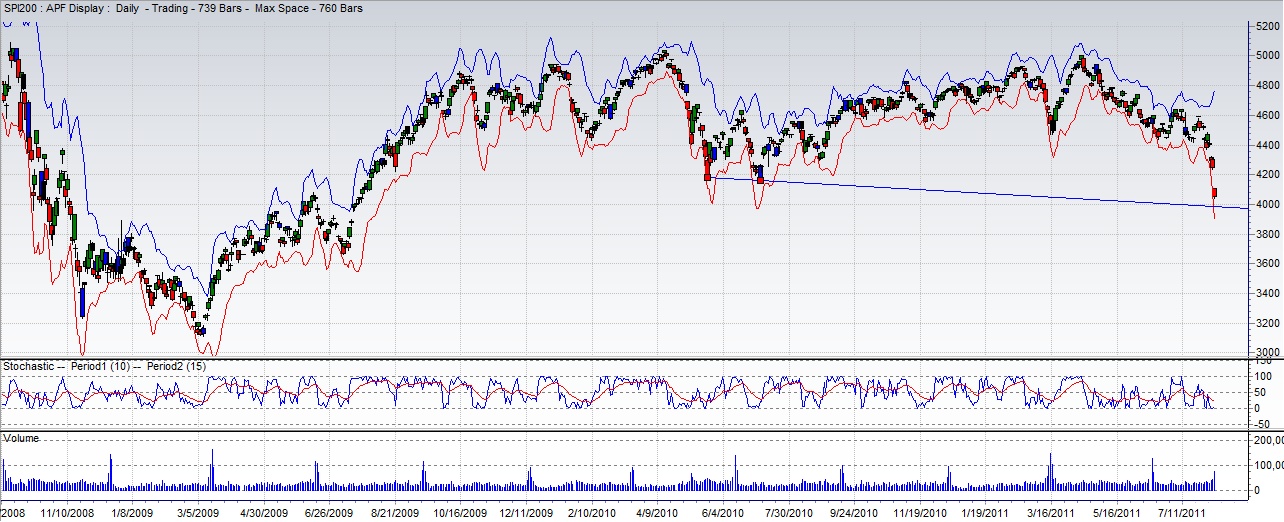
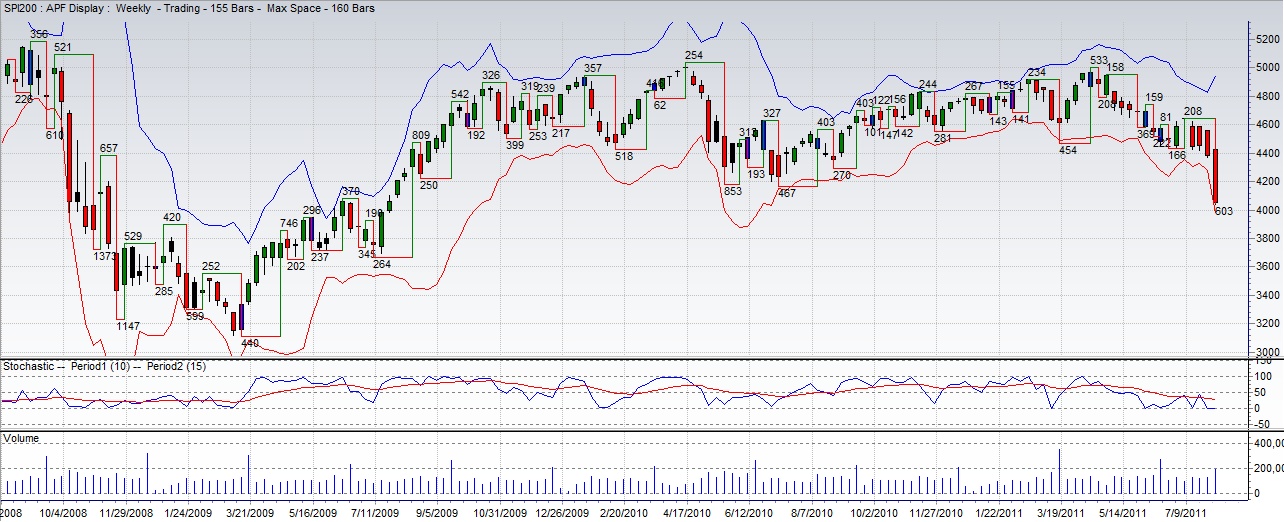
SPI 200 swing charts. Daily (above) and weekly (below).
Disclaimers & Undertakings
Today is the first day of the rest of your life !
email your tutor
© Copyright 2002-2009 Mind The Markets